
Are you looking to take your data reporting to the next level? Look no further than Google Data Studio. This powerful tool allows you to turn your raw data into visually stunning and informative reports that will impress your audience.
With easy-to-use drag-and-drop features, customizable templates, and real-time collaboration options, Google Data Studio is a game-changer for anyone looking to present data compellingly. In this article, we will walk you through the key features and tips for using Google Data Studio to create reports that are not only visually appealing but also packed with valuable insights.
Whether youre a marketer, analyst, or business owner, mastering Google Data Studio will elevate your reporting capabilities and help you make better-informed decisions based on your data. Let’s dive in and discover the endless possibilities of Google Data Studio!
Setting up Google Data Studio
Setting up Google Data Studio is a straightforward process that begins with signing into your Google account and navigating to the Data Studio homepage. From there, you can choose to start a new report or use a template.
Once you’ve selected your option, you’ll be taken to the report editor where you can begin customizing your report by adding data sources, charts, and visuals. The user-friendly interface allows you to drag and drop elements, adjust settings, and style your report to suit your needs.
With Google Data Studio, you have the power to create visually stunning and informative reports that will impress your audience and help you make data-driven decisions.
Connecting Data Sources
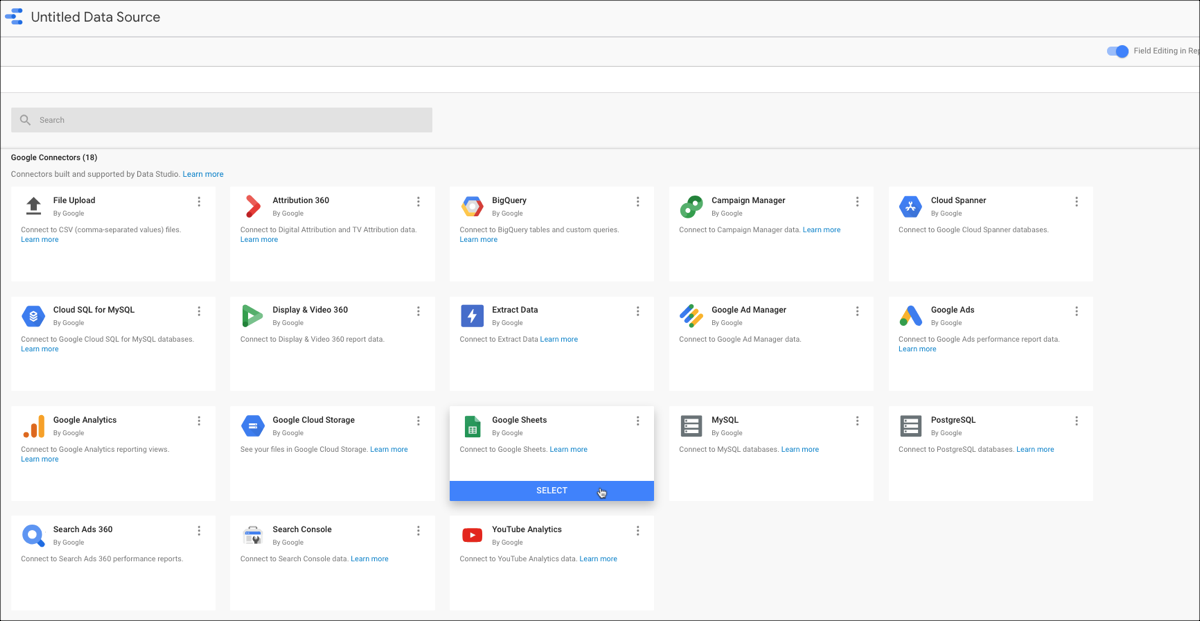
Connecting data sources is a fundamental step in creating comprehensive and insightful reports using Google Data Studio. By seamlessly integrating various data sources such as Google Analytics, Google Ads, and Google Sheets, users can combine and analyze data to gain a deeper understanding of their business performance. This process allows for a more holistic view of data, enabling users to identify trends, correlations, and opportunities that may have been previously overlooked.
Additionally, connecting data sources in Google Data Studio enables users to create dynamic and interactive reports that can be easily shared and customized to meet specific audience needs. With the ability to blend data from multiple sources, users can create stunning visuals and informative dashboards that provide valuable insights for decision-making and strategic planning.
Designing Visualizations
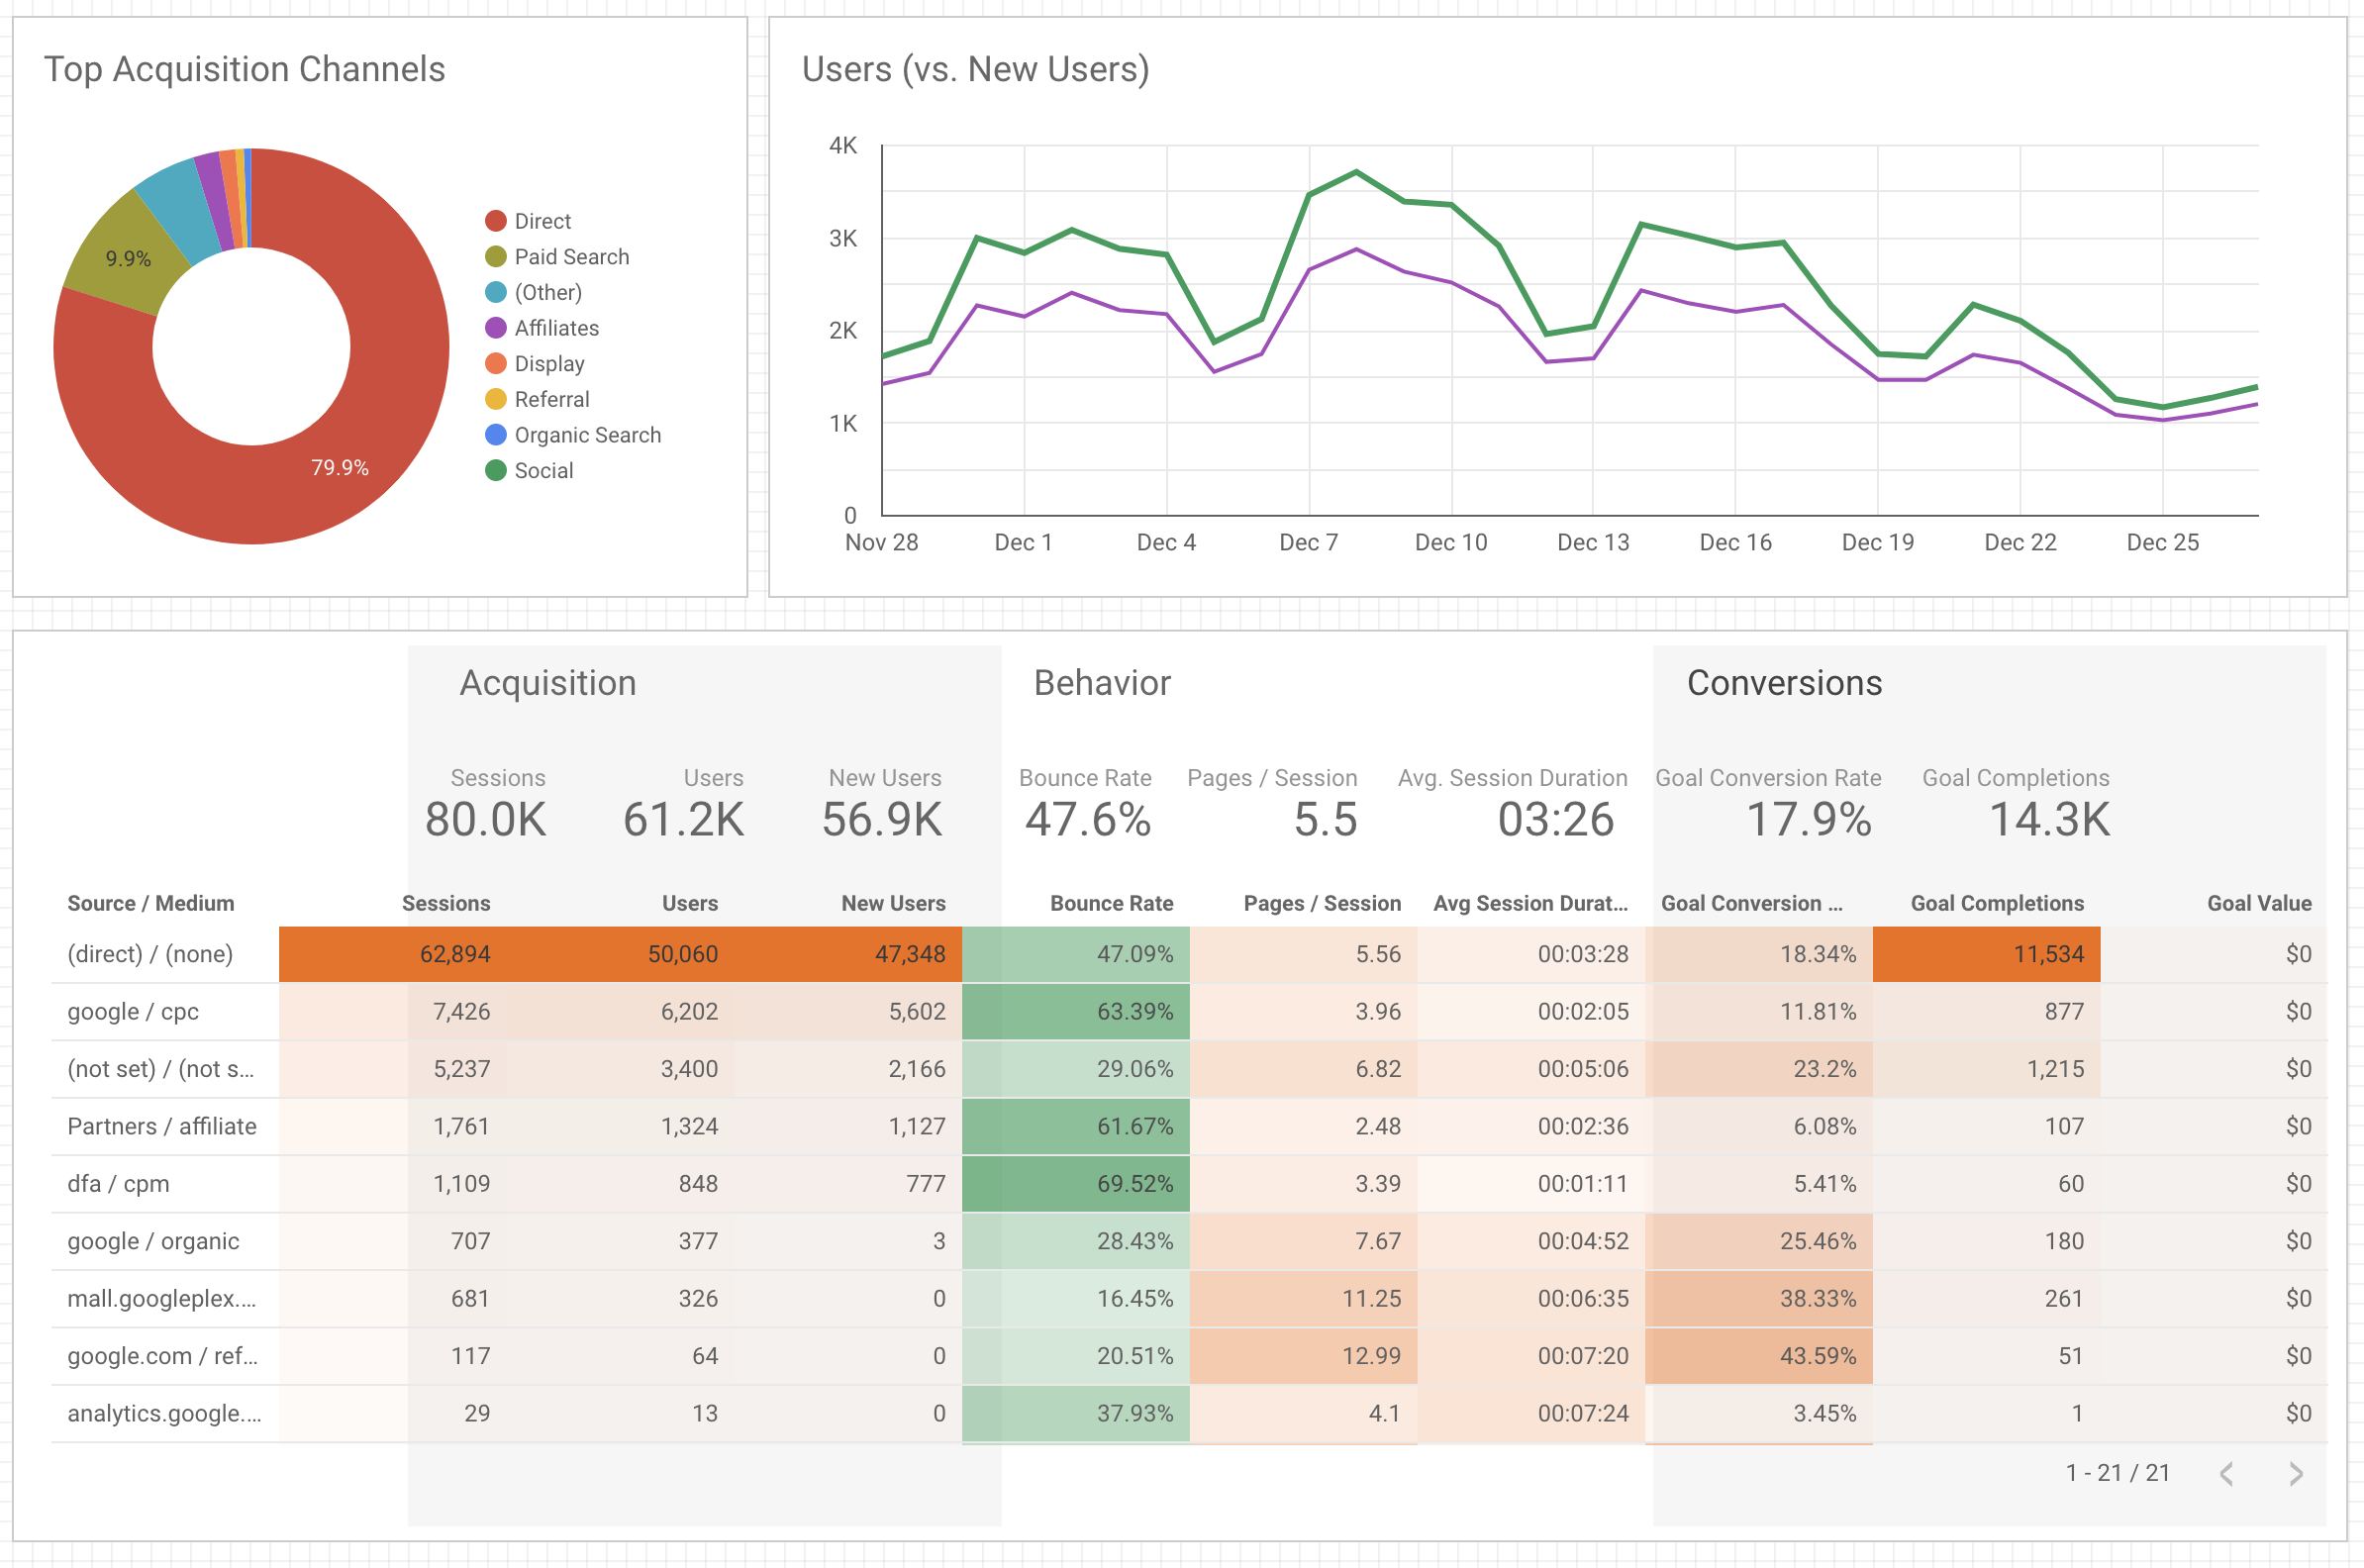
Designing visualizations in Google Data Studio is a crucial step in creating stunning and informative reports that effectively convey your data insights. By carefully selecting the right charts, graphs, and other visual elements, you can bring your data to life in a way that is easy to understand and visually appealing.
Consider using a mix of bar charts, line graphs, and pie charts to highlight different aspects of your data. Add in colors, labels, and annotations to make the information more engaging and impactful.
With an eye for design and a focus on clarity, your reports will not only be informative but also visually striking, making them more likely to grab the attention of your audience and drive home your key insights.
Customizing Reports
When it comes to customizing reports in Google Data Studio, the possibilities are endless. You can tailor the layout, color scheme, fonts, and data visualization to create reports that are not only visually stunning but also informative and easy to digest.
Whether youre presenting data to stakeholders, clients, or team members, customizing your reports can help you convey your message effectively and make a lasting impression. With Google Data Studios’ intuitive drag-and-drop interface, you can easily design reports that meet your specific requirements and showcase data in a way that resonates with your audience.
Don’t be afraid to experiment with different customization options to find the perfect look and feel for your reports.
Sharing and Collaboration Features
The sharing and collaboration features in Google Data Studio make it easy for teams to work together seamlessly on creating stunning and informative reports. With the ability to share reports with specific individuals or groups, as well as grant different levels of access and permissions, collaboration is effortless.
Additionally, real-time editing and commenting capabilities allow team members to provide feedback and make edits simultaneously, fostering a dynamic and efficient workflow. The intuitive interface and customizable sharing options ensure that everyone involved in the reporting process stays connected and on the same page.
Whether working on a simple project or a complex analysis, Google Data Studios’ sharing and collaboration features enhance teamwork and enable teams to produce high-quality reports efficiently.
Advanced Tips and Tricks

To take your Google Data Studio reports to the next level, consider implementing some advanced tips and tricks. Experiment with different data visualization options, such as heat maps or scatter plots, to convey information in a visually appealing way.
Customize your report with interactive elements like drop-down menus or date range selectors for a more engaging user experience. Utilize calculated fields to perform complex calculations or create custom metrics to better analyze your data.
Additionally, leverage the power of Google Analytics by integrating it with Data Studio to gain deeper insights into user behavior and website performance. By exploring these advanced features, you can create stunning and informative reports that effectively communicate your data to your audience.
Conclusion
In conclusion, Google Data Studio offers users a powerful tool to create visually appealing and informative reports that effectively communicate data insights. By leveraging the features and capabilities of Google Data Studio, businesses can streamline their report creation process and generate stunning reports that are easy to understand and share with stakeholders.
For those looking to take their reporting to the next level, Google Data Studio consulting services can provide expert guidance and support to optimize the use of this valuable tool. Overall, incorporating Google Data Studio into your reporting strategy can lead to more effective data-driven decision-making and enhance the overall impact of your reports.


